
Introduction to iStock Analytics Tools
The iStock Analytics Tools provide valuable insights for users looking to optimize their stock media sales. By utilizing these tools, contributors can effectively monitor their performance, analyze trends, and make informed decisions. This leads to improved strategies for boosting sales and maximizing revenue potential. In a competitive market, understanding how to leverage data becomes crucial for success.
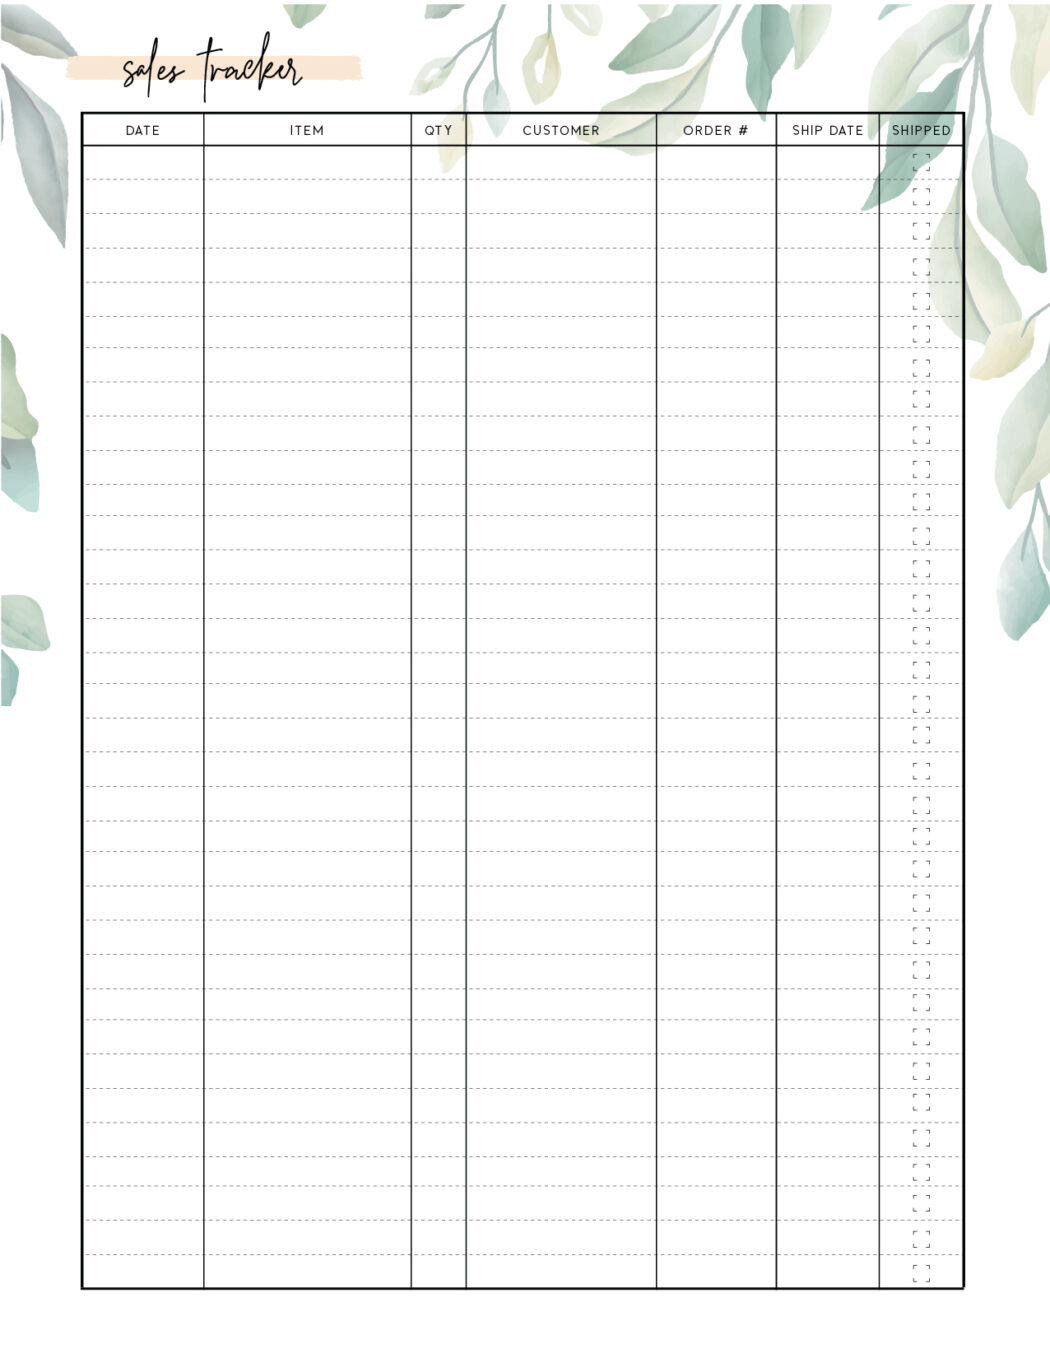
Understanding the Importance of Tracking Sales
Tracking sales through iStock analytics is essential for numerous reasons:
- Performance Assessment: Contributors can evaluate their sales performance over time, identifying what works and what doesn’t.
- Trend Identification: Analytics tools help in recognizing sales trends, seasonal fluctuations, and consumer preferences.
- Informed Decision-Making: With access to data, contributors can make strategic decisions on pricing, marketing approaches, and content creation.
- Sales Forecasting: By analyzing past data, users can forecast future sales, which aids in budgeting and planning.
- Competitor Analysis: Contributors can compare their performance against industry standards or competitors, revealing areas for improvement.
Overall, the effective use of iStock analytics tools empowers contributors to refine their sales strategies, enhancing their chances of success in the dynamic landscape of stock media sales.
Setting Up Your iStock Account for Analytics
Getting started with iStock’s analytics tools is a breeze, especially when you have a solid account set up. Setting up your iStock account for analytics not only helps you track your sales but also allows you to gain valuable insights into your performance. Here’s how to get started:
- Create Your Account: If you haven’t already, visit the iStock website and sign up for an account. Fill in the necessary details, including your payment information, to get access to advanced features.
- Complete Your Profile: Make sure to provide complete and accurate information about yourself and your work. This enhances your visibility and offers crucial context for the analytics tools.
- Enable Analytics: Go to your account settings and locate the analytics section. Ensure you activate this feature to start receiving insights into your sales performance.
- Add Your Payment Details: To track the sales accurately, ensure your payment information is up-to-date. This is essential for receiving any earnings information from sales analytics.
- Familiarize Yourself with Terms: Review the definitions of key performance indicators (KPIs) you’ll track, such as downloads, revenues, and trends.
- Set Goals: Think about what metrics are most important to you—whether it’s total sales, number of downloads, or earnings per image. Setting clear goals will help you measure your success effectively.
Once your account is ready, you’ll be set to dive into the analytics dashboard. The data you gather will be essential for optimizing your strategy and making informed decisions!
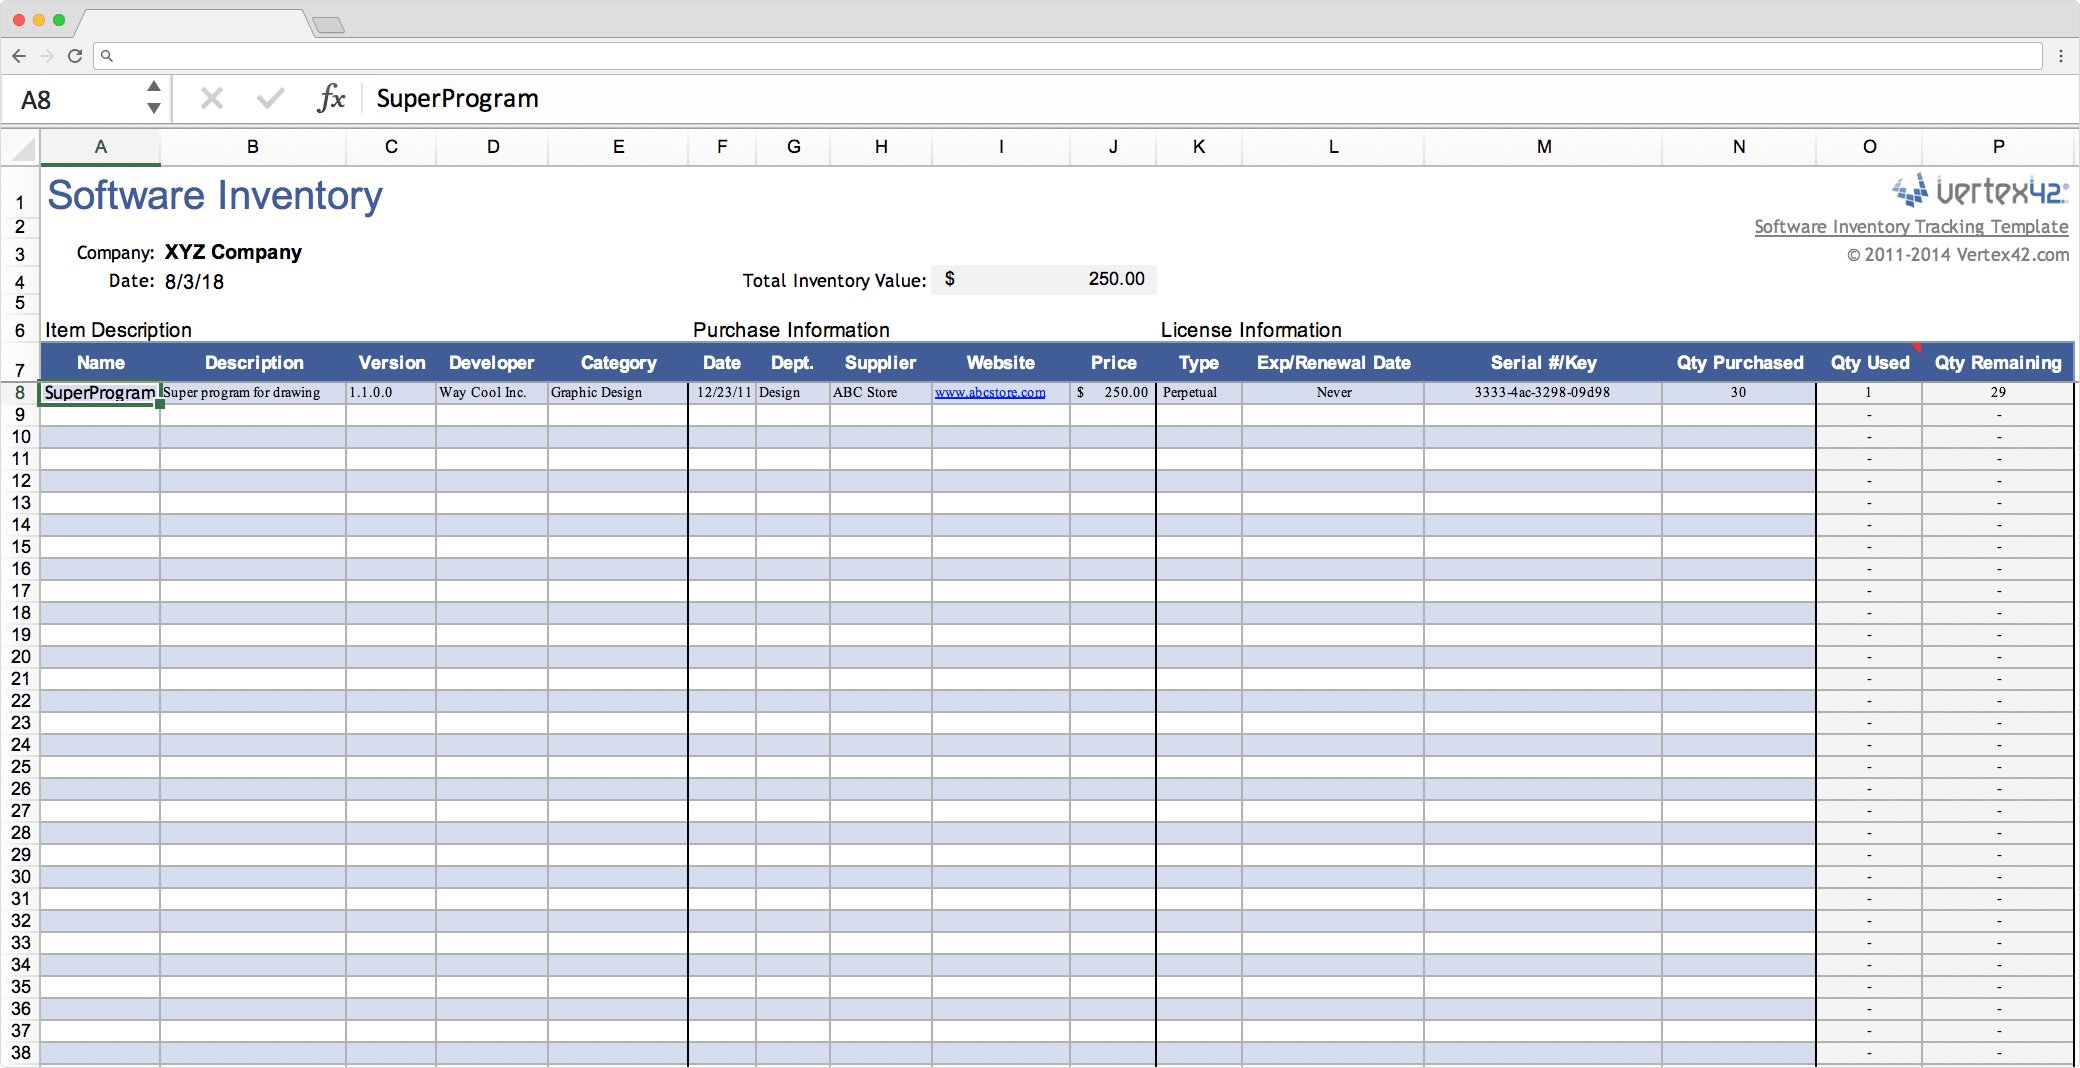
Navigating the iStock Analytics Dashboard
The iStock analytics dashboard can be a goldmine of information if you know how to navigate it. At first glance, it might seem overwhelming, but once you familiarize yourself with its layout, you’ll unlock its full potential. Here’s a breakdown of the key sections to focus on:
- Overview Section: This is your snapshot of performance. Here, you can see your total downloads, revenue, and trends over time. It’s like looking at the dashboard of your car—it gives you instant insight!
- Sales Insights: This specific area provides detailed reports on your sales. You can filter by date range, type of content sold, and even by geographical location to see where your work is most popular.
- Trends Analysis: Use this feature to identify which of your images are trending. It helps you understand market demand and adjust your offerings accordingly.
- User Engagement: Here, you can track how users are interacting with your content. Are they favoriting your work? Are they sharing it on social media? Understanding user engagement can inform your marketing strategies.
- Download Patterns: Examine daily or weekly patterns to see when your content is accessed the most. This can help you time your promotions and launches effectively.
As you explore the dashboard, consider creating a custom report that highlights the metrics that matter most to you. Keeping an eye on your performance will empower your creative direction and drive future sales!
Key Metrics to Monitor in iStock Analytics
When using iStock’s analytics tools, it’s crucial to focus on the right metrics to effectively track your sales and understand your content’s performance. Here are some key metrics you should monitor:
- Total Sales: This is the most straightforward statistic—tracking how many sales you make over a specific period. It helps you identify your best-selling items and seasonal trends.
- Earnings Per Download (EPD): Understanding how much you earn on average per download gives you insight into the profitability of your portfolio. A rising EPD indicates improving sales against your efforts.
- Conversion Rate: This metric shows the percentage of visitors who made a purchase after visiting your content. A low conversion rate might suggest that your visuals need improvement or that your marketing strategies need tweaking.
- Traffic Sources: Know where your customers are coming from. Are they finding you through search engines, social media, or direct visits? This information can inform your marketing strategies.
- Trending Keywords and Categories: Keep an eye on what’s popular! This can guide you in creating new content that aligns with current market demands.
By regularly monitoring these metrics, you’ll gain deeper insights into your sales performance, allowing you to make data-driven decisions that enhance your iStock portfolio’s profitability.
Tips for Interpreting Your Sales Data
Now that you’re tracking key metrics, how do you make sense of the data you’re collecting? Here are some practical tips for interpreting your sales data effectively:
- Look for Patterns: Analyzing your sales over time can reveal patterns. Are there certain months where sales spike? Understanding these trends helps you prepare for peak seasons.
- Segment Your Data: Break down your sales by category (e.g., images, videos) or by demographics. This segmentation lets you see where your strengths lie and where there might be opportunities for growth.
- Compare Against Benchmarks: Use industry benchmarks to identify how your stats stack up against similar contributors. This can help you set realistic goals and find motivation in your progress.
- Pay Attention to Feedback: Complement your sales data analysis with feedback received through reviews or client interactions. Sometimes, numbers aren’t enough to tell the whole story.
- Act on Insights: Lastly, don’t just gather data—use it! Whether it’s creating more of what sells well or reconsidering what’s underperforming, turn insights into action.
By following these tips, you’ll gain a clearer understanding of your sales data, enabling you to refine your strategy and optimize your success on iStock.
Best Practices for Using iStock Analytics Tools
To get the most out of iStock Analytics, it’s essential to adopt some best practices that will enhance your experience and provide you with valuable insights. Here are a few strategies to consider:
- Set Clear Goals: Before diving into the analytics, take a moment to define what you want to achieve. Are you looking to increase sales, understand customer behavior, or gauge the performance of your specific assets? Clear goals will guide your analysis.
- Regularly Review Your Data: Make it a habit to check your analytics regularly. Weekly or monthly reviews can help you spot trends over time and adapt your strategies accordingly. Don’t let great data go ignored!
- Utilize Comparison Tools: Take advantage of comparison features to analyze how your assets stack up against others in similar categories. This will give you insights into market demand and help you refine your offerings.
- Track Your Campaigns: If you’re running promotional campaigns, use iStock’s tools to monitor their performance. Look at metrics like downloads, views, and sales to determine what’s working and what isn’t.
- Act on Insights: Data is only useful if you act on it. Whether it’s adjusting your pricing, optimizing SEO on your assets, or focusing on high-performing categories, use your insights to inform your strategy.
By following these best practices, you can leverage iStock Analytics Tools effectively, helping you not only track your sales but also grow your presence and income in the market.
Case Studies: Successful Use of iStock Analytics
Many creators and businesses have harnessed the power of iStock Analytics to elevate their sales and strategies. Here are a few inspiring case studies that showcase successful use:
Case Study 1: A Freelance Photographer
A freelance photographer began using iStock Analytics and discovered that his landscape photos were his best sellers. By diving deeper into the analytics, he noticed seasonal trends—sales spiked during certain months. With this knowledge, he shifted his focus to capturing more landscape shots leading up to peak months, effectively boosting his income by 40%!
Case Study 2: A Small Design Studio
A small design studio utilized iStock’s comparison tools to analyze their sales data against industry benchmarks. They found that their pricing was slightly higher than competitors, leading to fewer downloads. After adjusting their pricing strategy based on analytics insights, they saw a 50% increase in downloads and a healthy boost to their overall sales.
Case Study 3: Marketing Campaign Success
A marketing team launched a targeted campaign using iStock assets and tracked its performance with the analytics tools. By monitoring user engagement and sales data, they identified which images resonated most with their audience, allowing them to refine future campaigns. As a result, their next project saw a 70% increase in engagement metrics!
These case studies illustrate how data-driven insights can lead to profound changes in strategy and outcomes. By effectively utilizing iStock Analytics, you can carve out your path to success in the competitive stock market landscape.
Common Challenges with Tracking Sales on iStock
When it comes to tracking your sales on iStock, it’s not always smooth sailing. Many contributors encounter a few common challenges that can make the process feel daunting. Let’s highlight some of these hurdles:
- Data Delays: Often, there can be a lag in reporting sales data. Contributors might find themselves checking their dashboards, only to see outdated figures. This delay can hinder timely decision-making.
- Understanding Metrics: iStock provides various metrics, but not every contributor understands what each one means. From “downloads” to “royalties,” it can be confusing to interpret the data effectively.
- Market Fluctuations: Sales can vary significantly due to market trends, seasonal demands, or changes in buyer behavior. Keeping up with these shifts can be challenging and can impact sales tracking.
- Technical Issues: Occasionally, users may face glitches or bugs within the iStock platform that can result in errors or inaccuracies in reported sales.
- Competitor Insights: iStock doesn’t provide extensive insights into competitors’ sales. This lack of information can make it difficult to gauge how your work is performing relative to others in your niche.
Recognizing these challenges is the first step towards overcoming them. By being aware of potential pitfalls, you can better strategize how to track your sales effectively and adjust your content strategy accordingly.
Conclusion and Next Steps for Sales Optimization
In conclusion, effective sales tracking on iStock is crucial for maximizing your potential as a contributor. By leveraging the platform’s analytics tools and addressing the common challenges, you can enhance your sales strategy.
Here are some actionable next steps you can take to optimize your sales:
- Set Clear Goals: Define specific sales targets and monitor them regularly. This clarity will help you focus your efforts.
- Regularly Review Analytics: Schedule time to go over your sales data at least monthly. Look for patterns and insights that can guide your future submissions.
- Experiment with Content: Test different styles, subjects, and formats of content. Pay attention to what resonates most with your audience.
- Stay Informed: Keep up with industry trends. Understanding what buyers are currently seeking can give you a competitive edge.
- Network with Other Contributors: Join forums or social media groups where you can share experiences and tips with other iStock contributors.
By taking these steps, you’ll not only improve your sales tracking but also set the stage for ongoing success on iStock. Remember, staying proactive is key to optimizing your sales performance!