The iStock Analytics Dashboard is a powerful tool designed to help users monitor and analyze their performance on the iStock platform. By utilizing this feature, contributors can gain valuable insights into their sales, track trends, and optimize their portfolios. Understanding how to navigate the dashboard can significantly enhance your ability to make data-driven decisions and improve your content strategy. In this guide, we will explore what the iStock Analytics Dashboard offers and why it is an essential resource for contributors.
Why Use the iStock Analytics Dashboard
The iStock Analytics Dashboard provides numerous benefits that can help enhance your experience as a contributor. Here are a few reasons why you should fully utilize this tool:
- Performance Tracking: Instantly view your sales data and performance metrics, allowing you to identify what sells best and when.
- Trend Analysis: Analyze trends over time, which can guide your content creation by highlighting seasonality and popular themes.
- Portfolio Optimization: Use the insights gained to improve your portfolio by focusing on high-performing content and exploring new creative directions.
- Comparative Insights: Compare your performance against industry benchmarks to understand how you stack up against other contributors.
- User-Friendly Interface: The dashboard is designed with ease of use in mind, making it accessible even for beginners.
By harnessing the capabilities of the iStock Analytics Dashboard, contributors can make informed decisions that elevate their work and enhance their income potential on the platform.
Setting Up Your iStock Account for Analytics
Getting started with the iStock Analytics Dashboard is an exciting step in optimizing your media usage. Before diving into the analytics, you’ll need to ensure your iStock account is properly set up to harness the full potential of the platform. Here’s a simple guide to help you through the setup process:
- Create an iStock Account: If you don’t already have an account, head over to the iStock website and sign up. You’ll need to provide some basic information like your email, password, and payment details.
- Complete Your Profile: Once you’re logged in, clicking on your profile will allow you to fill out additional details. This can include your business name, website, and preferences. Completing your profile helps iStock tailor recommendations and analytics specific to your needs.
- Link Payment Methods: For purchasing stock assets or subscription plans, make sure to link your preferred payment method. This ensures smooth transactions while using the platform.
- Activate Your Subscription: If you’re planning to use a subscription model, choose a plan that fits your needs. Consider factors such as the number of downloads and the type of assets you will require.
- Explore Content Type Preferences: Indicate your content preferences to help personalize your analytics experience. Choose between images, videos, and illustrations to get the most relevant analytics tailored to your usage.
Once you’ve taken these steps, you’ll be ready to dive into the analytics dashboard to monitor your usage and optimize your media purchases effectively!
Understanding the Dashboard Layout and Features
Now that your account is set up, let’s explore the iStock Analytics Dashboard layout and its powerful features. Understanding this dashboard will empower you to make informed decisions based on your usage data. Here’s what you’ll typically see upon logging in:
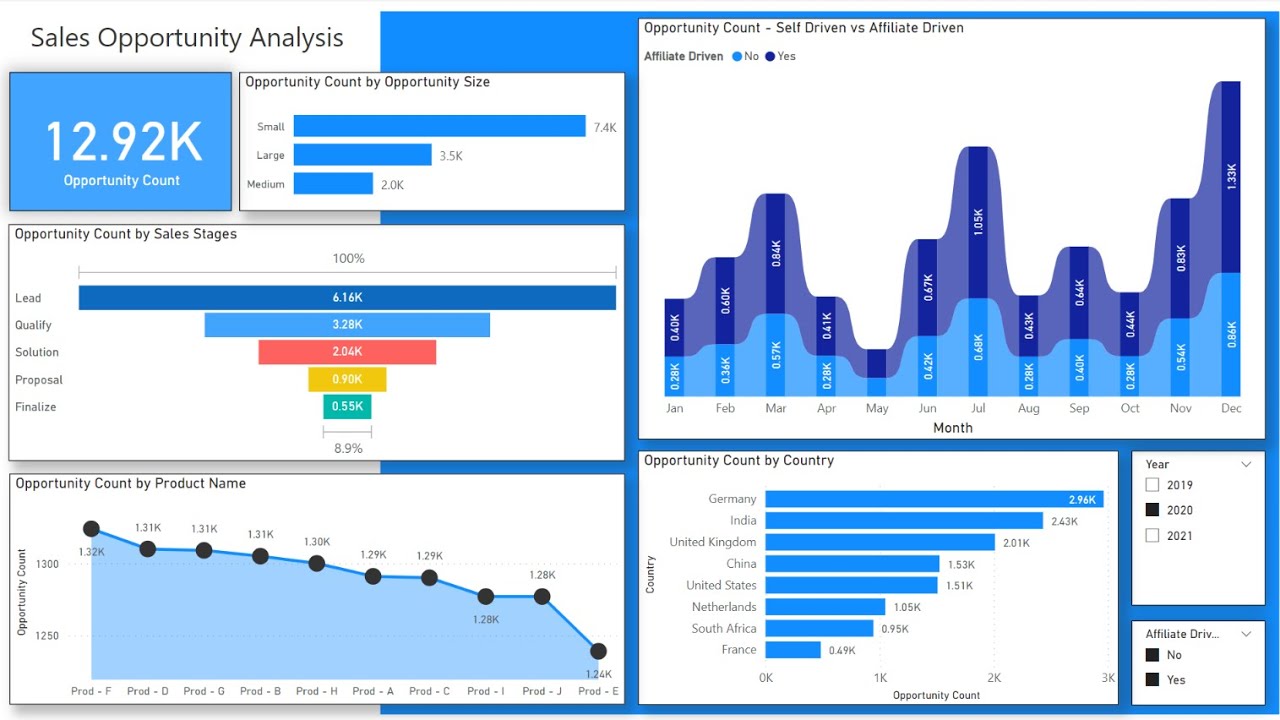
- Overview Section: The dashboard opens with a summary of your recent activity. It includes key metrics like your total downloads, asset types used, and a quick glance at your spending over time.
- Charts and Graphs: Visuals play a crucial role here! You’ll find various charts that illustrate trends in your usage. Look for:
- Monthly Download Trends – Visualizes how your asset downloads fluctuate over time.
- Asset Type Distribution – Shows which types of assets you use the most.
- Filter Options: Use filters to narrow down results by date, asset type, or project. This allows you to analyze data specific to your needs.
- Insights and Recommendations: iStock often provides suggestions tailored to your usage, whether it’s new trending assets or strategies to optimize your purchases.
With the right understanding of the dashboard layout and features, you can effortlessly track your usage, making data-driven choices that enhance your creative projects. It’s all about finding patterns and optimizing your processes!
Interpreting Analytics Data Effectively
Getting your hands on analytics data is just the first step; understanding what it all means is where the real gold lies. When you look at the numbers, it can be overwhelming. However, with a few key strategies, you can unlock valuable insights that can help improve your iStock experience.
Here are some tips for interpreting your analytics data effectively:
- Focus on Trends: Instead of fixating on individual data points, look for trends over time. Are your downloads increasing? Is there a spike in views after you upload new content? Identifying patterns can provide clues about what works.
- Segment Your Data: Break down your analytics by category, keyword, or type of content. This helps you understand which areas are performing best and where there may be opportunities for improvement.
- Set Benchmarks: Use your past performance as a benchmark to measure future success. If you see consistent downloads on specific types of images, aim to replicate that success in your new uploads.
- Utilize Visual Aids: Many analytics dashboards come with graphs and charts. These visual aids can make it easier to digest information quickly and use it to inform your strategy.
Remember, analytics data should guide your decisions, not overwhelm you. Take it step-by-step, focus on the metrics that matter most to your goals, and don’t hesitate to seek help or resources if you need clarification!
Tracking Your Performance Metrics
Performance metrics are the lifeblood of your iStock strategy. Tracking them is crucial for understanding how well your images are doing in the marketplace. Here’s how to keep your finger on the pulse of your performance.
To effectively track your performance metrics, consider monitoring the following key indicators:
| Metric | Description |
|---|---|
| Downloads | How many times your images have been downloaded. A direct indicator of popularity. |
| Views | The total number of times your images have been viewed. Higher views can indicate good visibility. |
| Sales Revenue | Your earnings from downloads. Tracking revenue can help assess ROI on your content. |
| Conversion Rate | How many views turn into downloads. This metric can help gauge the effectiveness of your content. |
To track these metrics, regularly check your analytics dashboard, and consider setting monthly or quarterly reviews. This will not only help you see how your content evolves but also how well it meets your business plans.
In summary, by keeping a close eye on these performance metrics, you set yourself up for growth and adaptation in the ever-changing world of stock photography.
Enhancing Your Content Strategy with Insights
In today’s fast-paced digital landscape, having a robust content strategy is essential for standing out. iStock’s Analytics Dashboard provides a treasure trove of insights that can significantly enhance your content strategy. Here’s how you can make the most of this powerful tool:
- Monitor Trends: Use the dashboard to observe which types of visuals, colors, or themes are gaining traction. This proactive approach can help you align your content with what’s currently resonating with your audience.
- Understand Audience Engagement: Analytics allow you to gauge how your audience interacts with your content. Track metrics like downloads and views to determine which assets captivate them the most.
- Content Gaps: Identifying gaps in your existing content can open up new opportunities. Look for topics that are not well-covered in your niche and create compelling visuals to fill that void.
- A/B Testing: Experiment with different styles and formats by utilizing insights from your previous campaigns. The dashboard can help you determine what works best through comparative analysis.
- Optimize SEO Strategies: Utilize keyword insights provided in the dashboard to enhance your image SEO. By tailoring your content strategy around high-performing keywords, you can improve visibility and attract more organic traffic.
In essence, leveraging the insights from the iStock Analytics Dashboard will empower you to make informed decisions that reshuffle your content strategy into a more dynamic and responsive format that resonates with your audience.
Common Challenges and How to Overcome Them
Navigating the iStock Analytics Dashboard can feel overwhelming at first, especially for beginners. Here are some common challenges users face and tips on how to overcome them:
| Challenge | Solution |
|---|---|
| Understanding Data Metrics | Take time to review tutorials and guides on key metrics. Getting familiar with terms like “CTR” (Click-Through Rate) and “engagement rate” will help you interpret data accurately. |
| Information Overload | Focus on the metrics that matter most for your goals. Create a checklist of KPIs (Key Performance Indicators) relevant to your content strategy to filter out noise. |
| Adapting to Insights | Change can be daunting. Start by making small, incremental adjustments to your strategy based on the insights you gather. This fosters gradual improvement and reduces resistance. |
| Limited Resources | Maximize the use of available tools. If your team is small, prioritize using analytics to inform your essential content pieces. Quality over quantity can make a significant difference. |
| Lack of Time | Create a routine for regular check-ins with your analytics. Even dedicating 15-30 minutes weekly can provide valuable insights and keep your strategy aligned. |
By recognizing these challenges and implementing these solutions, you’ll find that navigating the iStock Analytics Dashboard becomes easier over time, ultimately enhancing the effectiveness of your content strategy.
Best Practices for Using the iStock Analytics Dashboard
Getting the most out of the iStock Analytics Dashboard can significantly enhance your experience and improve your stock media strategy. Here are some best practices to consider:
- Regularly Review Your Data: Make it a habit to check your dashboard weekly or monthly. Regular reviews can help you spot trends, understand what’s working, and identify areas for improvement.
- Set Clear Goals: Before diving into the analytics, ask yourself what you want to achieve. Are you aiming to increase downloads, improve engagement, or track specific campaigns? Clear goals will help you focus on the relevant metrics.
- Utilize Filters: The dashboard offers various filters to help you customize your view. Use these to segment your data by time, category, or geography to gain deeper insights.
- Compare Performance: Take advantage of the comparison features to evaluate the performance of different assets or campaigns. Seeing what resonates with your audience can guide your future content creation.
- Export Data for Deeper Analysis: If you’re comfortable with spreadsheets, you can export your analytics data. This allows for more advanced analysis and the ability to create tailored reports for your stakeholders.
- Stay Updated: iStock regularly updates its dashboard features. Keep an eye out for new tools and capabilities that could enhance your analysis or reporting efforts.
By following these best practices, you’ll be well on your way to leveraging the full potential of the iStock Analytics Dashboard!
Conclusion and Next Steps
Congratulations on getting acquainted with the iStock Analytics Dashboard! You now have a foundational understanding of how to navigate the platform, interpret the data, and utilize insights to augment your media strategy. As you move forward, consider these next steps:
- Experiment with Features: Spend some time exploring all the functionalities available. The more you explore, the better you will understand what works specifically for your needs.
- Follow Industry Trends: Keep an eye on broader trends in stock media and analytics. This will give you context for your data and help you stay ahead of the curve.
- Join Online Communities: Engage with fellow iStock users through forums or social media groups. Sharing experiences can provide new insights and enhance your learning.
- Create a Reporting Routine: Develop a reporting process that aligns with your business goals. Regularly updated reports will keep your team informed and engaged with your media efforts.
- Seek Support When Needed: Don’t hesitate to reach out to iStock support or consult the help center if you have questions or encounter challenges. They can provide valuable assistance!
As you implement these steps, you’ll find yourself becoming more proficient and confident in using the iStock Analytics Dashboard. Happy analyzing!