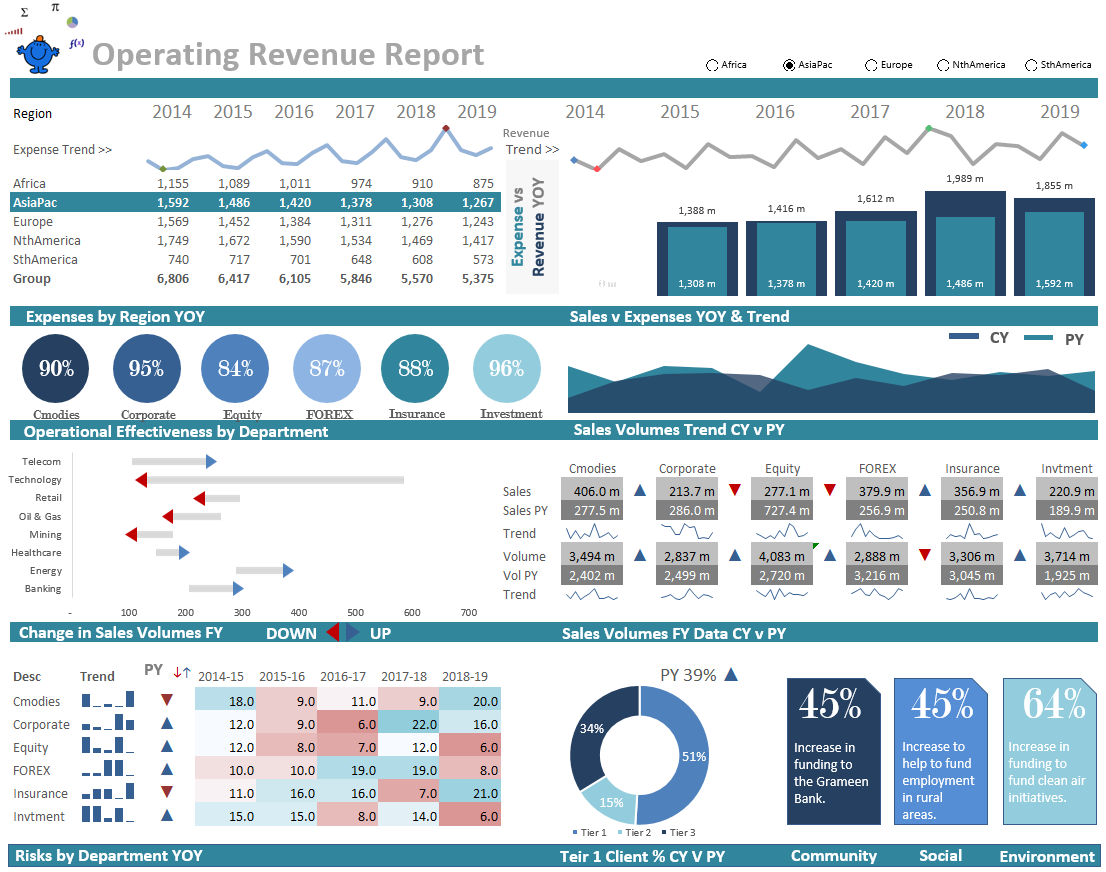
The Foap Analytics Dashboard is designed to provide users with insights into their performance, engagement, and sales on the platform. This guide will help you understand the key features of the dashboard and how to access it, ensuring you can make informed decisions and optimize your experience on Foap.
Understanding Foap Analytics Dashboard Features

The Foap Analytics Dashboard offers several essential features that help users track their performance:
- Sales Overview: A summary of your earnings, showcasing total sales, trends, and the most successful products.
- Engagement Metrics: Insights into user interactions, including likes, comments, and shares on your uploads.
- User Demographics: Information about your audience, such as geographic location and age, which can inform your marketing strategies.
- Performance Comparison: A feature that allows you to compare the performance of different uploads over specific periods.
- Trends Analysis: Identifies which types of content are performing best, enabling you to tailor your uploads to audience preferences.
Each of these features helps users understand their market position, refine their strategies, and enhance their content based on analytical insights.
How to Access Your Foap Analytics Dashboard
Accessing your Foap Analytics Dashboard is straightforward. Follow these steps:
- Log in to your Foap account on the official website or mobile app.
- Navigate to your profile by clicking on your avatar or username.
- Locate the “Analytics” tab in the menu; this will lead you to your dashboard.
- Once there, explore different sections to view sales data, engagement stats, and more.
- Utilize the provided filters to customize your view based on date ranges or specific uploads.
Regularly checking your dashboard will help you stay informed about your performance and make data-driven decisions to enhance your Foap experience.
Navigating the Dashboard Interface
Welcome to the heart of your Foap experience—the Analytics Dashboard! This is where all your creative efforts come to life through insightful data. At first glance, the dashboard might seem overwhelming, but once you familiarize yourself with its layout, you’ll find it intuitive and user-friendly.
Upon logging in, you’ll notice the main navigation bar on the left side of the screen. Here’s a quick overview of what you’ll find:
- Overview: A snapshot of your overall performance at a glance.
- Metrics: Detailed data about your photos and sales.
- Trends: Visualization tools to spot patterns over time.
- Reports: Downloadable summaries for deeper analysis.
The central part of the dashboard is dominated by graphical representations of your data, including charts and graphs. These visual aids help in quickly understanding your performance metrics. One of the best features is the ability to customize your dashboard layout. You can drag and drop elements to highlight stats that matter most to you—perfect for staying focused on your goals!
Don’t forget to explore the filter options at the top right. You can sort data by date range, type of photo, or specific campaigns, making it easier to hone in on particular areas of interest. Whether you’re tracking daily sales or monthly views, these tools give you the granular insights you need to make informed decisions.
Key Metrics and Data Insights in Foap Analytics
The Foap Analytics Dashboard isn’t just a pretty interface; it’s packed with essential metrics that provide valuable insights into your performance. Understanding these metrics can help you refine your strategies and boost your sales.
Here are some key metrics you’ll want to keep an eye on:
- Total Sales: This shows how many products you’ve sold over a given period. Tracking this metric is crucial for assessing your overall performance.
- Average Price per Photo: Knowing how much you make per photo can help you adjust pricing strategies and target the right audience.
- Engagement Rates: This includes likes, shares, and comments. High engagement often indicates a connection with your audience.
- View Count: Tracking how many people see your photos can inform you about your visibility and marketing effectiveness.
In addition to these metrics, Foap provides comparative insights. You can compare your performance over different time frames, which is incredibly useful for identifying trends and seasonal fluctuations in interest.
Remember, the real power lies in how you use this data. Regularly reviewing these metrics will allow you to adapt your approach, experiment with different styles, and understand what resonates best with your audience. Embrace the analytics—it’s your roadmap to success on Foap!
Utilizing Analytics to Enhance Your Foap Experience
In the ever-evolving world of online selling, leveraging analytics can be a game changer for your success on Foap. If you’re passionate about photography and looking to monetize your talent, understanding how to use the analytics tools provided by Foap is essential. Here’s how you can enhance your experience:
- Track Your Sales Trends: Regularly check your sales data to identify which photos are performing well. This helps you understand what buyers are looking for, allowing you to tailor your future submissions.
- Monitor Audience Engagement: Pay attention to user interactions with your portfolio. Look for data on likes, comments, and shares, and use this feedback to refine your style and subject matter.
- Refine Your Tagging Strategy: Good tagging can make or break your chances of being discovered. Use analytics to find out which tags are linked to your best performers, and employ them strategically in future uploads.
- Test and Learn: Experiment with different genres, styles, or themes based on the data insights you gather. Note what resonates with your audience and adjust your photography approach accordingly.
By actively utilizing Foap’s analytics, you can fine-tune your approach, ultimately leading to increased sales and a deeper connection with your audience. Remember, the more data you analyze, the more you can adapt your strategy to align with market demands.
Interpreting Sales and Artist Performance Data
Understanding your sales and artist performance data on Foap is crucial for navigating the competitive landscape of digital photo sales. Here’s how to get started:
- Sales Breakdown: Your sales data is typically categorized by product types, such as prints or digital downloads. Look closely at which types sell the most; for instance, you might discover that prints of landscapes perform better than portraits.
- Session Analytics: Analyze when your best sales occur. Are there specific days or times of the week when customers are more likely to purchase? This insight can inform when you should focus your promotional efforts.
- Artist Ranking: Understand where you stand compared to other artists. Foap often provides rankings based on sales. Use this information to motivate yourself and set realistic targets for improvement.
- Customer Insights: Pay attention to demographic data if available. Knowing who your buyers are—age, location, preferences—can help you create content catered to their tastes.
Remember, the key to taking your photography business to the next level on Foap is not just in capturing great images, but also in effectively harnessing the data available to you. Regularly reviewing and interpreting your sales and performance metrics can align your creative output with the market needs, ultimately enhancing your overall success.
Strategies for Improving Your Foap Listings Based on Analytics
Understanding the analytics from your Foap listings can give you a powerful advantage in increasing visibility and sales. Here are some effective strategies to enhance your listings based on the insights you gather:
- Optimize Your Tags: Review your analytics to see which tags are generating the most views and sales. If certain keywords are getting more traction, make sure to incorporate them into your future listings for better discoverability.
- Enhance Photo Quality: If your analytics indicate high views but low purchases, it might be time to elevate your photography. Consider using natural lighting, focusing on composition, or even investing in a better camera or editing software.
- Engage With the Community: Analytics can show you how interaction affects sales. Join Foap challenges and engage with other users through comments and shares—community engagement can significantly impact your listing’s visibility.
- Adjust Your Pricing: Take note of what pricing strategies work for top sellers. If your listings aren’t performing, experiment with different price points. Sometimes, a small adjustment can lead to a big change in sales.
- Regularly Update Listings: Keeping your content fresh is crucial. Utilize insights on what’s working well to regularly refresh older listings. New titles, updated descriptions, and recent tags can rekindle interest.
By leveraging these insights and strategies, you’ll not only improve your listings but also enhance your overall experience on Foap!
Common Questions About Foap Analytics Dashboard
The Foap Analytics Dashboard can be a bit overwhelming, especially if you’re new to it. Here are some common questions and answers to help demystify the dashboard:
| Question | Answer |
|---|---|
| What metrics can I track on the dashboard? | You can track metrics such as views, downloads, sales, and performance over time for each photo listed. |
| How often is the data updated? | The data on the Foap analytics dashboard is typically updated in real-time, allowing you to see the most current performance of your listings. |
| Can I see analytics for multiple photos at once? | Yes, you can compare performance across different photos sequentially and track overall trends within your portfolio. |
| Is there a way to export my analytics data? | Currently, Foap doesn’t offer an export feature, but you can take screenshots or note manual metrics for further analysis. |
| How can I use these insights to market my listings? | Utilize your best-performing tags and photo styles in future marketing efforts. Share standout images on social media platforms to drive more traffic. |
These answers should clear up some confusion about the analytics dashboard and help you make the most of your Foap experience. If you have additional questions, don’t hesitate to ask the Foap community for support! Happy selling!
Foap Analytics Dashboard Overview and Guide
The Foap Analytics Dashboard is an essential tool for photographers and brands alike, providing key insights into how photos are performing in the marketplace. This guide delves into the various features of the dashboard, empowering users to optimize their photography portfolios and maximize sales potential.
Key Features of the Foap Analytics Dashboard:
- Sales Metrics: Monitor sales figures such as the total number of downloads, revenue generated, and best-selling images.
- User Engagement: Track how users are interacting with your photos, including likes and comments.
- Trending Images: Identify which of your photos are trending and understand what makes them popular.
- Market Insights: Gain insights into current market trends and customer preferences to tailor your offerings.
- Performance Comparisons: Compare your performance against other photographers and identify areas for improvement.
To navigate the Foap Analytics Dashboard effectively, familiarize yourself with its layout:
| Section | Description |
|---|---|
| Overview | Your overall performance summary, including key metrics at a glance. |
| Sales | Detailed breakdown of downloads, revenue, and highest earning images. |
| Engagement | Statistics on likes, comments, and user interaction. |
| Trends | Current trends that can educate your photography choices going forward. |
In conclusion, the Foap Analytics Dashboard offers profound insights that can enhance your photography business. By closely monitoring performance metrics and adapting to trends, photographers can elevate their sales strategies and thrive in a competitive marketplace.


