Have you ever stumbled upon the WordPress debug.log and noticed that the timestamps in the log files are off? You’re not alone! Many developers encounter this issue, which can lead to confusion when tracing errors or debugging. In this post, we’ll explore how to fix wrong date and time settings in your WordPress debug.log while using Visual Studio Code (VSCode). By understanding and correcting these timestamps, you’ll have a clearer picture of what’s happening on your site.
Understanding WordPress Debug.log

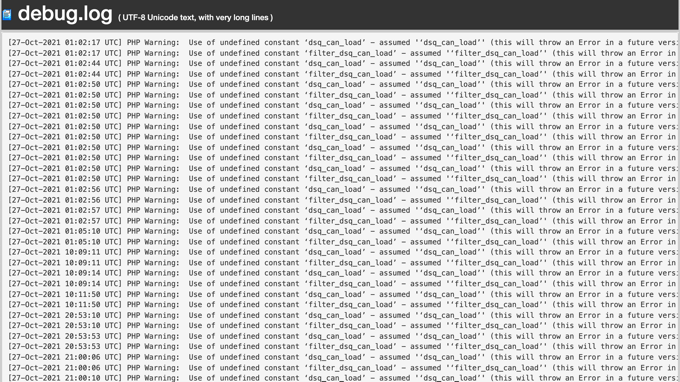
The debug.log file in WordPress is an invaluable tool for developers and site owners. It records PHP errors, warnings, and notices, making it easier to identify and resolve issues. Let’s dive deeper into what this file is and why it’s important:
- What is Debug.log?
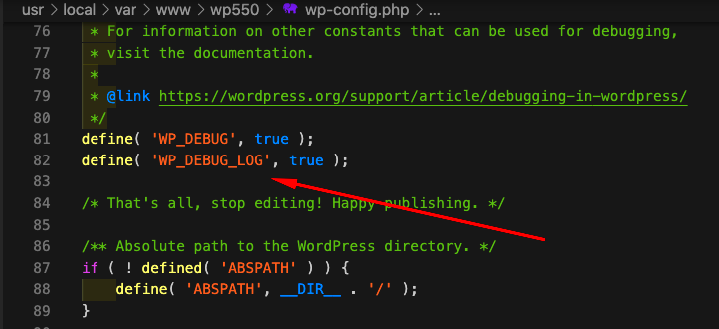
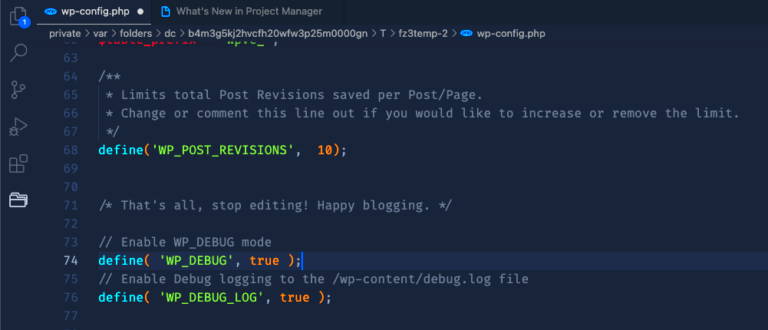
It’s a plain text file generated by WordPress when debugging is enabled. To access it, you usually navigate to/wp-content/debug.log. - Why Enable Debugging?
Debugging can help you:
- Identify PHP and coding errors efficiently
- Track down performance issues
- Understand plugin or theme complications
- Common Errors Captured
The debug.log captures various types of issues, including:
- Fatal errors (like memory limit exhaustion)
- Warnings (like deprecated functions)
- Notices (non-critical nudges to improve your code)
However, if the date and time on your debug.log appear incorrect, it can complicate the troubleshooting process. Before diving into solutions, it’s essential to grasp how WordPress handles time and the importance of server time settings. We’ll tackle these issues shortly, so hang tight!
Common Issues with Date and Time in Debug.log

When you’re digging through your debug.log file in WordPress, you might notice some peculiarities regarding date and time. These inconsistencies can lead to confusion and misinterpretation of errors, making it harder to debug your site effectively. Let’s explore some common issues you might encounter.
- Incorrect Timezone Settings: If your WordPress timezone is set incorrectly, the timestamps in the debug.log will reflect this. This can lead to logs showing future times if your server is in a different timezone or vice versa.
- Server Time Discrepancies: Sometimes, the server hosting your WordPress site might not be synchronized with Network Time Protocol (NTP) servers. This results in an overall skew in timestamps, making it difficult to correlate errors with actual events in real-time.
- Daylight Saving Time (DST) Confusion: If your region observes DST and your WordPress settings don’t account for it, you may find that log timestamps shift an hour forward or backward during these transitions.
- Format Issues: Timestamps in the debug.log are typically formatted in a standard way, but if your logs appear garbled or inconsistent, it could be due to plugin conflicts that affect logging.
To effectively troubleshoot these issues, take note of the timestamps. Understanding what they denote will help you pinpoint problems faster, allowing you to adjust your configurations accordingly!
Checking Your WordPress Site Time Settings

Getting your date and time settings right in WordPress is crucial for maintaining an organized and efficient debugging process. If you’ve noticed odd timestamps in your debug.log, it’s time to check your WordPress settings. Let’s walk through how you can do this.
Steps to Check Time Settings
- Log into Your WordPress Dashboard: Start by logging into your WordPress admin area. You’ll want to have access to the settings directly.
- Go to Settings > General: In the dashboard menu, navigate to Settings and then click on General.
- Check Timezone Settings: Look for the Timezone option. Ensure that it reflects your actual timezone. You can select a specific city from the list or choose the UTC offset that suits your location.
- Save Changes: After making the necessary adjustments, be sure to scroll down and click Save Changes to apply your new settings.
By following these steps, you can ensure that your WordPress site’s timing aligns with your local time, resulting in more accurate logs and easier debugging. If you’re still experiencing issues after this, consider checking your server’s configuration as well! Remember, accurate time settings can save you a lot of headaches down the road.
5. Adjusting Server Time Settings
When facing issues with incorrect timestamps in your WordPress debug.log, the first step you might want to take is to adjust the server time settings. A mismatched server clock can lead to all sorts of confusion, especially when it comes to logging errors and debugging your site.
You can check the server’s current date and time by running the following command via SSH:
date
It’s important that the server’s date and time align with your local time zone. Here’s how you can adjust these settings:
- Use NTP (Network Time Protocol): This ensures that your server clock is synchronized with internet time servers. Generally, NTP is already installed on most servers, but you may need to enable the service.
- Set the Correct Time Zone: Most servers allow you to change the time zone. You can set it using the command:
sudo timedatectl set-timezone Your/Timezone
Check the time zone settings by running:
timedatectl
After making these adjustments, it’s a good idea to restart your web server to ensure the changes take effect. This should resolve discrepancies in the timestamps recorded in your WordPress debug.log.
6. Configuring VSCode for Debugging
Visual Studio Code (VSCode) is popular among developers due to its flexibility and array of extensions. To efficiently debug your WordPress site, you need to properly configure VSCode to leverage its powerful debugging capabilities.
Here’s a straightforward guide to get you started:
- Install PHP Debug Extension: Begin by installing the PHP Debug extension in VSCode. You can find it in the Extensions Marketplace by searching for “PHP Debug.” This extension allows you to debug PHP scripts right from the editor.
- Set Up Xdebug: Ensure you have Xdebug installed on your server. Xdebug is a powerful tool that provides debugging and profiling capabilities. You can check if it’s enabled by running the following command:
php -m | grep xdebug
If Xdebug is not installed, you’ll need to follow the specific installation steps for your server environment.
| Configuration Settings | Value |
|---|---|
| Remote Enable | 1 |
| Remote Host | localhost |
| Remote Port | 9000 |
Once Xdebug is configured, navigate to the debug panel in VSCode (left sidebar) and create a launch configuration. Add a new configuration with settings that point to your server URL. Each time you set a breakpoint within your code, you can run the debugger, and it will stop at each breakpoint, allowing you to inspect variable states and the call stack.
With everything set up, you’re now ready to debug your WordPress application effectively using VSCode!
Fixing Date and Time Format Issues
When you work with a WordPress site, one of the most common annoyances you might encounter is having the wrong date and time in your debug.log. This can create confusion and hinder troubleshooting if you’re trying to solve an issue based on the timestamps in the log. Fortunately, fixing date and time format issues in WordPress is a straightforward process!
First, you need to ensure that your WordPress installation is correctly set up to reflect your preferred timezone. To do this, navigate to:
- Go to your WordPress Dashboard.
- Click on Settings and select General.
- Look for the Timezone setting.
- Select the appropriate timezone from the dropdown menu.
- Don’t forget to save your changes!
However, even after setting the correct timezone, the debug log might still display timestamps in UTC format or a different format than you expected. If that’s the case, you might need a little more tweaking. You can customize the date and time format by adding a filter in your theme’s functions.php file:
add_filter('date_format', function($format) { return 'Y-m-d H:i:s'; // Adjust format as needed});With this code, you can specify the exact format you want! Choose a format that suits your needs best. For example, you could use:
- Y-m-d H:i:s for a full timestamp.
- m/d/Y for a simpler date format.
- D, d M Y for a more human-readable format.
After you make these adjustments, your debug.log will reflect the date and time the way you want it. You’ll be able to troubleshoot issues more efficiently with more useful timestamps!
Verifying Changes and Monitoring Debug.log
Once you’ve made the necessary adjustments to fix the date and time format in your debug.log, it’s time to verify that everything is working correctly and that your changes are properly reflected in the log. Monitoring the debug.log is crucial for effective troubleshooting and ensuring that your WordPress site runs smoothly.
Here’s a step-by-step guide to help you through the verification process:
- First, trigger a potential error on your site to generate a new entry in the
debug.log. This could be as simple as a small coding mistake, or you can enable debugging in WordPress for this purpose. - Next, navigate to your WordPress installation’s debug log, generally found in the
wp-contentdirectory. You can open this file in your code editor or directly view it in a text format. - Look for the last entry added to the log file. Check the date and time to ensure they reflect your desired format.
As you’re monitoring the debug.log, it’s important to check for a few key things:
- Timestamp accuracy: Ensure that the logged timestamps match the correct timezone and format you’ve set up.
- Error severity: Note the severity of the logged errors (notice, warning, error) and address them accordingly.
- Repetitive issues: Look for any recurring errors that need immediate attention.
Tools like Visual Studio Code can help you track changes in the debug log more effectively. You can even install extensions that facilitate better monitoring of file changes!
In summary, verifying your changes and monitoring the debug.log should be a regular part of your WordPress maintenance regimen. With clear timestamps and a thorough understanding of logged issues, you’ll be well-equipped to maintain a healthy WordPress site!
Conclusion
Fixing the wrong date and time in the WordPress debug.log file when viewed in VSCode is essential for maintaining accurate logs and efficient troubleshooting. By following the steps mentioned, you can ensure that your log files accurately reflect the time of events occurring on your site. Here’s a quick recap:
- Check WordPress Time Zone Settings: Navigate to the WordPress admin dashboard and configure the time zone under Settings > General.
- Verify Server Time Zone: Ensure that your server’s date and time are set correctly. You can do this via the command line with the command
date. - Edit the PHP Configuration: Check the
php.inisettings for thedate.timezonedirective and set it accordingly. - Use PHP Functions: Consider using PHP functions like
date_default_timezone_set()within your custom code to define your preferred time zone.
By following these practices, you can effectively resolve issues related to incorrect timestamps in your debug logs. This will not only improve your workflow but also enhance your ability to debug and address issues promptly.


